

Nicholas Nhundu and Farisai Chin'anga
South Africa has high data prices compared to other countries globally. The parliamentary portfolio committee on telecommunications and postal services conducted a two day hearing in September (2016) to investigate the high data prices in South Africa. In these hearings the South African mobile network operators (MNOs) submitted that the primary reason for high data costs was the “spectrum crunch” in large urban areas. Spectrum crunch is the lack of sufficient wireless frequency spectrum needed to support a growing number of consumer devices which include cell phones, radios and televisions. Reallocation of spectrum is largely determined by government regulation, and limited access to additional spectrum compels the MNOs to spend more on physical network infrastructure which is more costly, thereby increasing the price of data.
A recent study conducted by the research organisation, Tariffic, established that South Africa’s contract data prices, for example, are 134% higher than the average of the lowest contract data prices in Kenya, Australia and BRICS member countries Brazil, Russia, India and China. However, the analysis focuses more on the price of data without taking into consideration other factors such as the cost structures of MNOs.
This article contributes to these debates by comparing South African data prices with those in other countries, and assessing whether there are cost differentials which might explain the differences, as a first step towards understanding the high prices of data. South African price and cost structures are compared to those in Nigeria and Ghana primarily as these countries have the cheapest data prices in Africa and therefore serve as suitable benchmarks to establish possible reasons for the higher data prices. Comparators in Kenya and Rwanda are also considered to a lesser extent. We use MTN Africa as a case study firm given that it is present as a market leader in each of the three countries under review.
In South Africa MTN controls approximately 34% of the market share of subscribers, whereas in Nigeria and Ghana it holds 45% and 52%, respectively. Moreover, MTN is the only MNO which operates across the 3 countries under review which allows for consistency in the definitions of cost centres and accounting principles, making comparisons easier and clearer. MTN is also a listed firm which means its information is publicly available in addition to the availability of disaggregated data across the three countries.
Pricing and revenue
The average prepaid price of data in South Africa compared to average prices in Nigeria, Ghana, Kenya and Rwanda is given below (Figure 1). The prices were calculated as the average price for one gigabyte of 30-day prepaid data charged by a number of MNOs in each country including MTN.1
The results show that South African prices are significantly higher than the benchmarks utilised with prices (R153) that are more than double or 164% higher than prices in Ghana (R58), and almost five times those in Nigeria (R32). South African prices are also significantly higher than those in Kenya (R66) and Rwanda (R21).
An analysis of MTN revenue streams across Nigeria, Ghana and South Africa (Table 1) confirms relatively high prices in South Africa. In the 2015 financial year MTN South Africa made more data revenue than MTN Nigeria and MTN Ghana combined. Important to note here is the fact that MTN South Africa has approximately 31 million subscribers overall whereas MTN Nigeria and MTN Ghana had 61 million and 16 million subscribers, respectively, as at 31 December 2015.
Data revenue per subscriber is also significantly higher for MTN South Africa than MTN Nigeria and MTN Ghana. On average MTN South Africa makes 182% more in data revenue per subscriber than Nigeria and Ghana.
Figure 1: Average price of 1-gig 30-day prepaid data (December 2016)
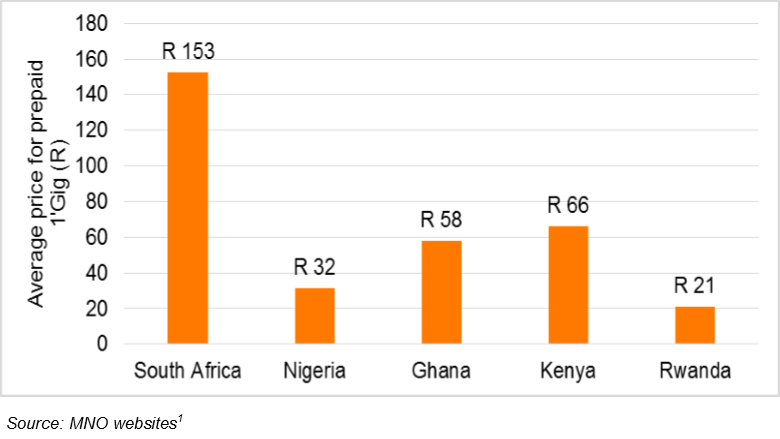
Table 1: MTN revenues for 2015 financial year

Source: Own calculation from MTN Group 2015 annual report (data sheets)
Cost analysis
The actual costs of delivering a gigabyte of bandwidth remain difficult to assess in the telecommunications industry across the world. MNOs claim that it is difficult to calculate the specific costs of delivering bandwidth since the costs vary based on the type of technology being utilised, the user’s location and the time of the day.
Consequently, because the actual costs are not clear it is difficult for users to assess whether they are being charged a reasonable price. However, the big price differentials across countries could be indicative of the extent of market power that a player has in each country.
In the cost assessment below (Table 2), only costs per subscriber are analysed to ensure comparability amongst the three countries. Shared costs have been apportioned between voice and data based on the ratio of data revenue as to total revenue of the respective countries.
Total costs per subscriber of R112 in South Africa are relatively higher than those in Nigeria (R65) and Ghana (R57). This is partly as result of high salaries and wages that are paid in South Africa which are on average three times higher than what is paid in Nigeria and Ghana based on the annual reports. There are also different spectrum assignments across the
Table 2: MTN costs for 2015 financial year

Source: MTN Group 2015 annual report (data sheets)
Notes: Other data related costs include staff costs, marketing costs, and other operating expenditure which also include administrative costs, fuel, electricity/generators to power network towers etc, and costs of value added services offered e.g. balance check, top up, buying data off airtime, SMS lotteries etc.
three countries, different types of data 3G/4G, and different usage between voice and data services. Nevertheless the key question is whether those costs are high enough to justify prices that are (on average) more than twice the amount that is charged in Nigeria and Ghana? To assess this further we look at profit margins across the three countries (Figure 2).
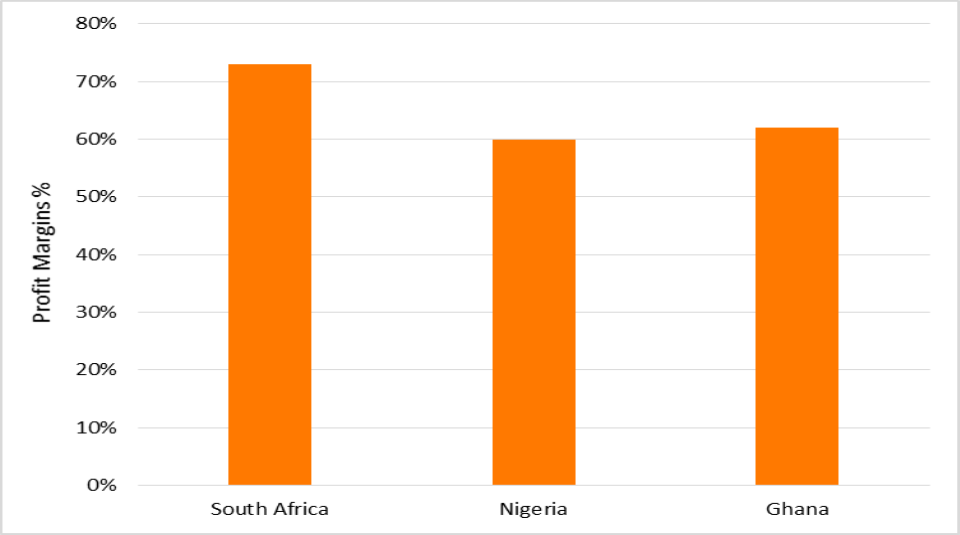
Although South Africa has higher costs per subscriber than Nigeria and Ghana, on average South African margins (73%) are 22% higher than Nigeria (60%) and Ghana (62%). The implication of this is that MTN’s 1-gig data prices in South Africa could decrease by 33% if a similar average margin of around 60% is applied.
Figures 2: Internet data margins 2015 financial year
Source: MTN Group 2015 annual report (data sheets)
Note: Profit margins calculated using data revenue per subscriber (Table 1) and total costsper subscriber (Table 2)
Competition dynamics
Competition dynamics in each country also affect differentials in pricing. Although the Nigeria and Ghana telecoms markets can be defined as concentrated, there is significant rivalry amongst the players which has seen intense competition resulting in a significant drop in prices of services as players innovate and adopt the latest technology. In Nigeria none of the MNOs operating in the country have a dominant position in the internet data market. Ghana has one of the most competitive mobile bandwidth industries in Africa, with a population of 25 million people that is serviced by six operators.
This contrasts with South African telecoms industry which has a higher C3 concentration ratio (97%) relative to Nigeria (84%) and Ghana (82%). Other than a relatively high concentrated industry in South Africa, there is also an issue of low levels of competitive rivalry amongst the key players. The first movers in South African mobile telecommunications, Vodacom and MTN gained significant market power, constructed extensive networks and set prices in a relatively weak regulatory environment. They continue to reap the benefits of this, and challenger firms have struggled to grow their market share because the playing field is not level. Moreover barriers to entry and expansion are high which prohibits the proliferation of new players in the sector.
Conclusion
Although South Africa has higher total costs relative to Nigeria and Ghana, company margins show that on average South African margins are on average 22% higher than Nigeria and Ghana.
Competition dynamics within each country partly explain the different prices being charged, suggesting that there would be benefits to greater rivalry in the South African market where there is low competitive rivalry amongst the lead MNOs.